Vegetation and Habitat Data
Vegetation and Habitat Data#
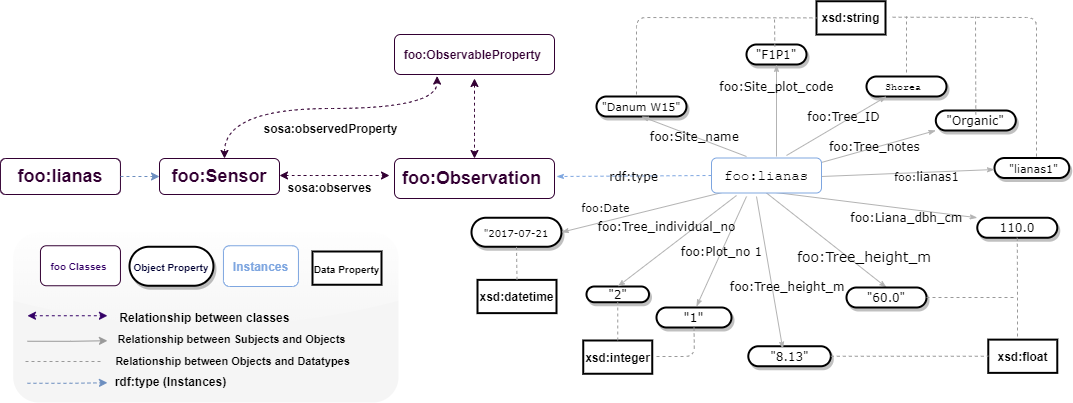
These datasets comprise plant records from forty-nine plots spread among fourteen fragmented forest areas and four continuous forest sites in Sabah, Malaysian Borneo. Live vegetation and deadwood were surveyed at two to three sites at each of the eighteen sites. In addition to vegetation data, the dataset contains measurements of topsoil characteristics, forest structure measures, and metrics of the degree of forest fragmentation in the surrounding landscape of the plots. These data were collected so that studies could be done on (1) the factors that help exotic plant species take over fragmented forest areas and (2) the value of conservation set-asides for carbon storage and plant diversity in oil palm plantations. Further data can be found at https://github.com/Naeima/Forest-Observatory-Ontology/tree/main/Vegetation.
!pip install rdflib

from google.colab import files
import pandas as pd
import csv
from rdflib import Graph, Namespace, URIRef, Literal
from rdflib.namespace import RDF, XSD

# Prompt for file upload
uploaded = files.upload()

# Read the uploaded CSV file into a pandas DataFrame
for filename in uploaded.keys():
    print('User uploaded file "{name}" with length {length} bytes'.format(
        name=filename, length=len(uploaded[filename])))
    df = pd.read_csv(filename)

# Define namespaces
# Define namespaces
FOO = Namespace("https://w3id.org/def/foo#")
SOSA = Namespace("http://www.w3.org/ns/sosa/")
GEO = Namespace("http://www.w3.org/2003/01/geo/wgs84_pos#")

# Create a new graph
g = Graph()

# Bind namespaces
g.bind("foo", FOO)
g.bind("sosa", SOSA)
g.bind("geo", GEO)

# Process data from DataFrame
for index, row in df.iterrows():
    site_name = row.get('Site_name', '').strip()
    plot_no = row.get('Plot_no', '')
    site_plot_code = row.get('Site_plot_code', '')
    date = row.get('Date', '').strip()
    tree_individual_no = row.get('Tree_individual_no', '')
    tree_id = row.get('Tree_ID', '').strip()
    tree_dbh_cm = row.get('Tree_dbh_cm', '')
    tree_height_m = row.get('Tree_height_m', '')
    tree_n_lianas = row.get('Tree_N_lianas', '')
    liana_dbh_cm = row.get('Liana_dbh_cm', '')
    tree_notes = row.get('Tree_notes', '')
    subplot_radius_m = row.get('Subplot_radius_m', '')

    # Create tree observation URI
    tree_observation = URIRef(f"https://w3id.org/def/foo#lianasObservation{tree_individual_no}")
    g.add((tree_observation, RDF.type, FOO.treeObservation))
    g.add((tree_observation, FOO.id, Literal(tree_individual_no, datatype=XSD.string)))
    g.add((tree_observation, FOO.siteName, Literal(site_name, datatype=XSD.string)))
    g.add((tree_observation, FOO.plotNo, Literal(plot_no, datatype=XSD.integer)))
    g.add((tree_observation, FOO.sitePlotCode, Literal(site_plot_code, datatype=XSD.string)))
    g.add((tree_observation, FOO.date, Literal(date, datatype=XSD.date)))
    g.add((tree_observation, FOO.treeIndividualNo, Literal(tree_individual_no, datatype=XSD.integer)))
    g.add((tree_observation, FOO.treeID, Literal(tree_id, datatype=XSD.string)))
    g.add((tree_observation, FOO.treeDbhCm, Literal(tree_dbh_cm, datatype=XSD.double)))
    g.add((tree_observation, FOO.treeHeightM, Literal(tree_height_m, datatype=XSD.double)))
    g.add((tree_observation, FOO.treeNLianas, Literal(tree_n_lianas, datatype=XSD.integer)))
    g.add((tree_observation, FOO.lianaDbhCm, Literal(liana_dbh_cm, datatype=XSD.double)))
    g.add((tree_observation, FOO.treeNotes, Literal(tree_notes, datatype=XSD.string)))
    g.add((tree_observation, FOO.subplotRadiusM, Literal(subplot_radius_m, datatype=XSD.double)))
    g.add((tree_observation, FOO.hasFeatureOfInterest, FOO.tree))
    g.add((tree_observation, FOO.madeBySensor, FOO.treeSensor))

# Serialize the graph to a file
output_file = "lianas_knowledge_graph.ttl"
g.serialize(destination=output_file, format="turtle")

print(f"Knowledge graph has been serialized to {output_file}")

# Download the file
files.download(output_file)
''''
```python
# # Code to add data to stardog
# import stardog

# conn_details = {
#   'endpoint': 'http://localhost:5820',
#   'username': 'admin',
#   'password': 'admin'
# }
# with stardog.Admin(**conn_details) as admin:
#     lianas = admin.new_database('lianas')

# conn = stardog.Connection('lianas', **conn_details)

# conn.begin()

# conn.add(
#     stardog.content.File('Aqeela.rdf', stardog.content_types.TURTLE),
# #     graph_uri=graph_uri)
# conn.commit()